Debugger in CodeBlocks
- The debugger in CodeBlocks is a very useful tool that you can use to see what your program is doing on a line by line basis.
Initial Setup
- First, you will want to make sure your debugger is setup correctly. Navigate to the settings button at the top of the page, then click “Debugger”.
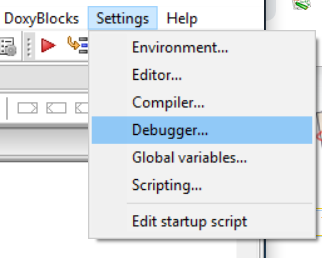
Doing so should open this window…
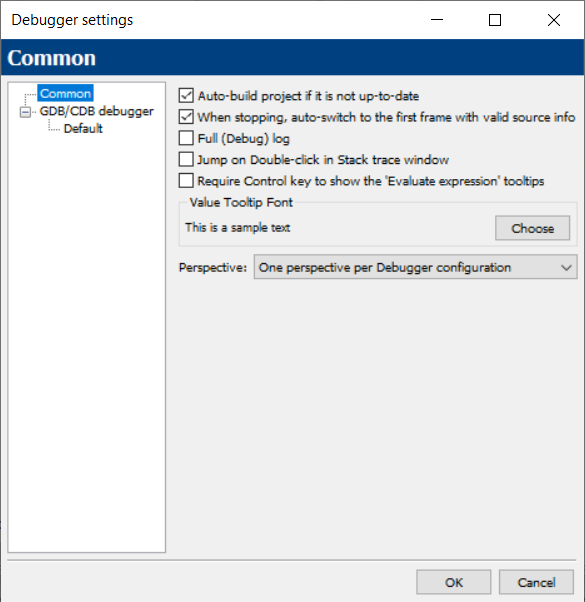
- Once in this window, in the left column, click on default. After doing so it should look like this.
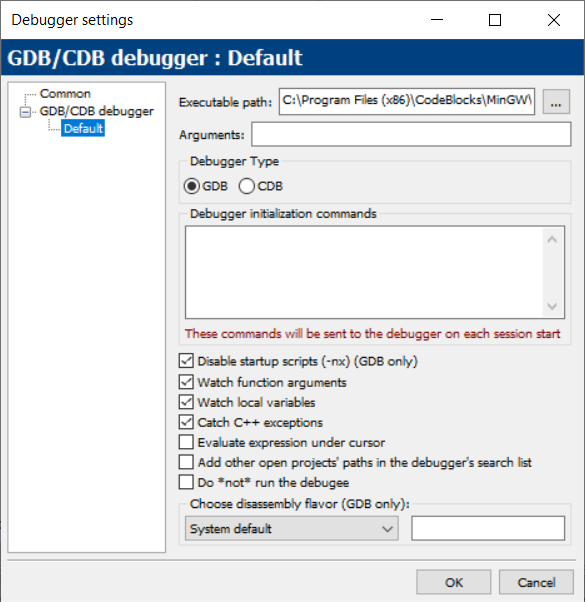
- The thing that you need to check is the very top bar that says “Executable path:”. The exact path should be,
C:\Program Files (x86)\CodeBlocks\MinGW\bin\gdb32.exe
- After double checking that your path is correct, your debugger should now be functional.
Breakpoints
- Breakpoints are markers you use to tell your program to stop execution at a certain line, and start executing line by line using the toolbar controls. To set a breakpoint, right click on the line number you wish to set a breakpoint on and select 'Add Breakpoint'.
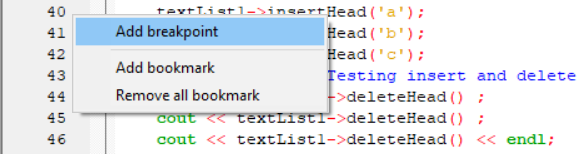
You should see a red marker pop up on the selected line after clicking this. You now have a breakpoint set in your program, this is where your debugger will start.
Watches
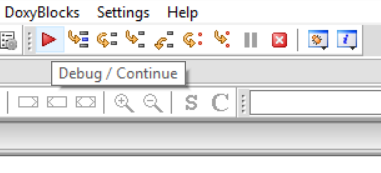
- Watches are how you view the state of your variables when you are moving through your program. To set the program to 'watch' a variable, first make sure your debugger is running by clicking the red arrow at the top that says 'Debug/continue'.
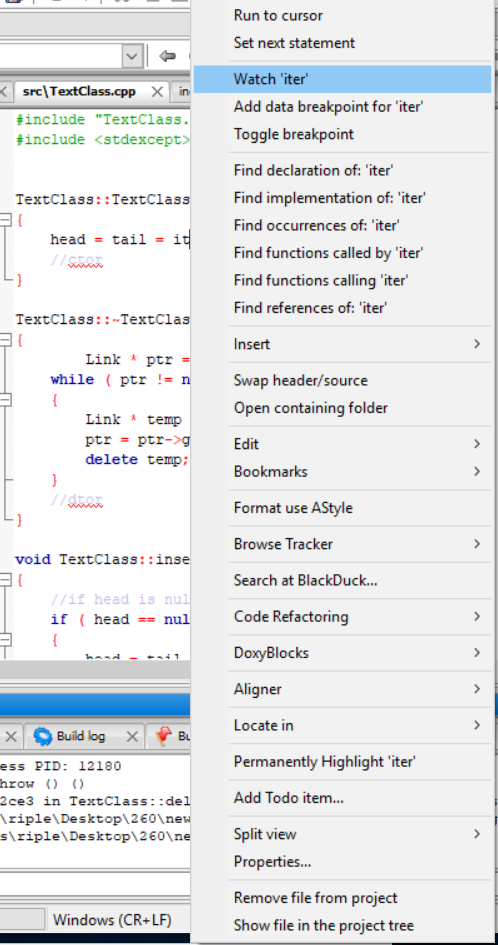
- Next, find the variable in your code, be it in the declaration or wherever you may have it, and right click on it. It should then pull up this long list of options for you. Select, “Watch 'variableNameHere'”. In this instance I have selected to watch a variable named 'iter'.
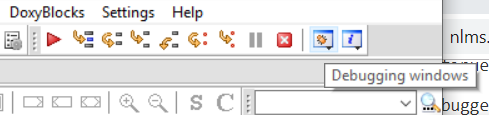
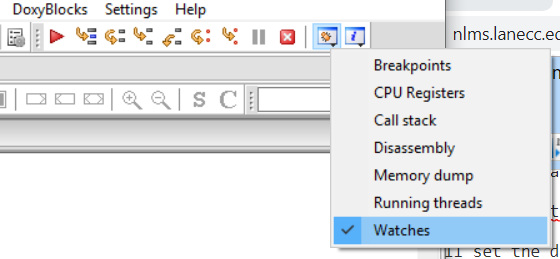
- This will set the debugger to 'watch' that variable. You can now pull up the watches window and it will tell you what you have stored in that variable as you step through your program. To pull up the watches window, navigate to the debugging tool bar, and click “Debugging Windows”. Then click “Watches” from the drop-down menu.
- Then click “Watches”.
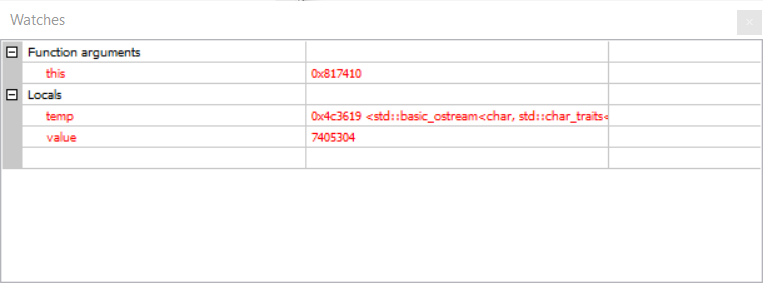
- Doing this will pull up the Watches window which will show you all of your variable information. It should look like this…
Debugger Toolbar Controls
- Starting from the left side of the toolbar, directly to the right of the red arrow you will find the “Run to cursor” button.
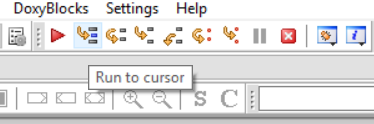
- The run to cursor button basically functions as a second breakpoint. Clicking this button will automatically start the debugger and directly stop the debugger where you are targeting it to stop. It is also important to note that this secondary breakpoint clears once the program reaches this line of execution.
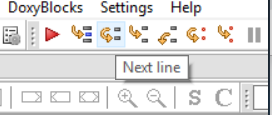
- The next line button will step through your program line by line. If you use this to proceed into a line with a function call, it will execute the function without stepping into it. This button is the equivalent of a “step over” button in some other IDEs.
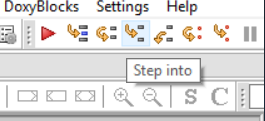
- The step into button will step into called functions. If you use “next line” to progress your code to a function call, you can then use “step into” to proceed into that function, and your code will go into that function as opposed to stepping over it with “next line”.
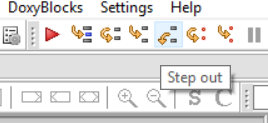
- The step out button, if pressed within a function, will execute the rest of that given function and proceed to the line after the function call and stop.
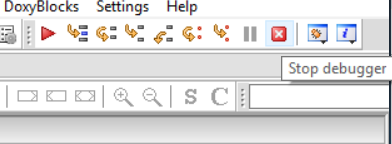
- This one's pretty self explanatory. Clicking this button will stop the debugging process.
